VANCOUVER / CONTINUOUS SOURCE TRANSPORT

SO₂ transport
over Vancouver.

Blue–white concentration fields over shaded terrain, with synchronized fixed-receptor curves.

4 November 2026, 18:00 UTC → 19 November 2026, 18:00 UTC

01 / ANIMATION

Surface and elevated transport

360 actual hourly means
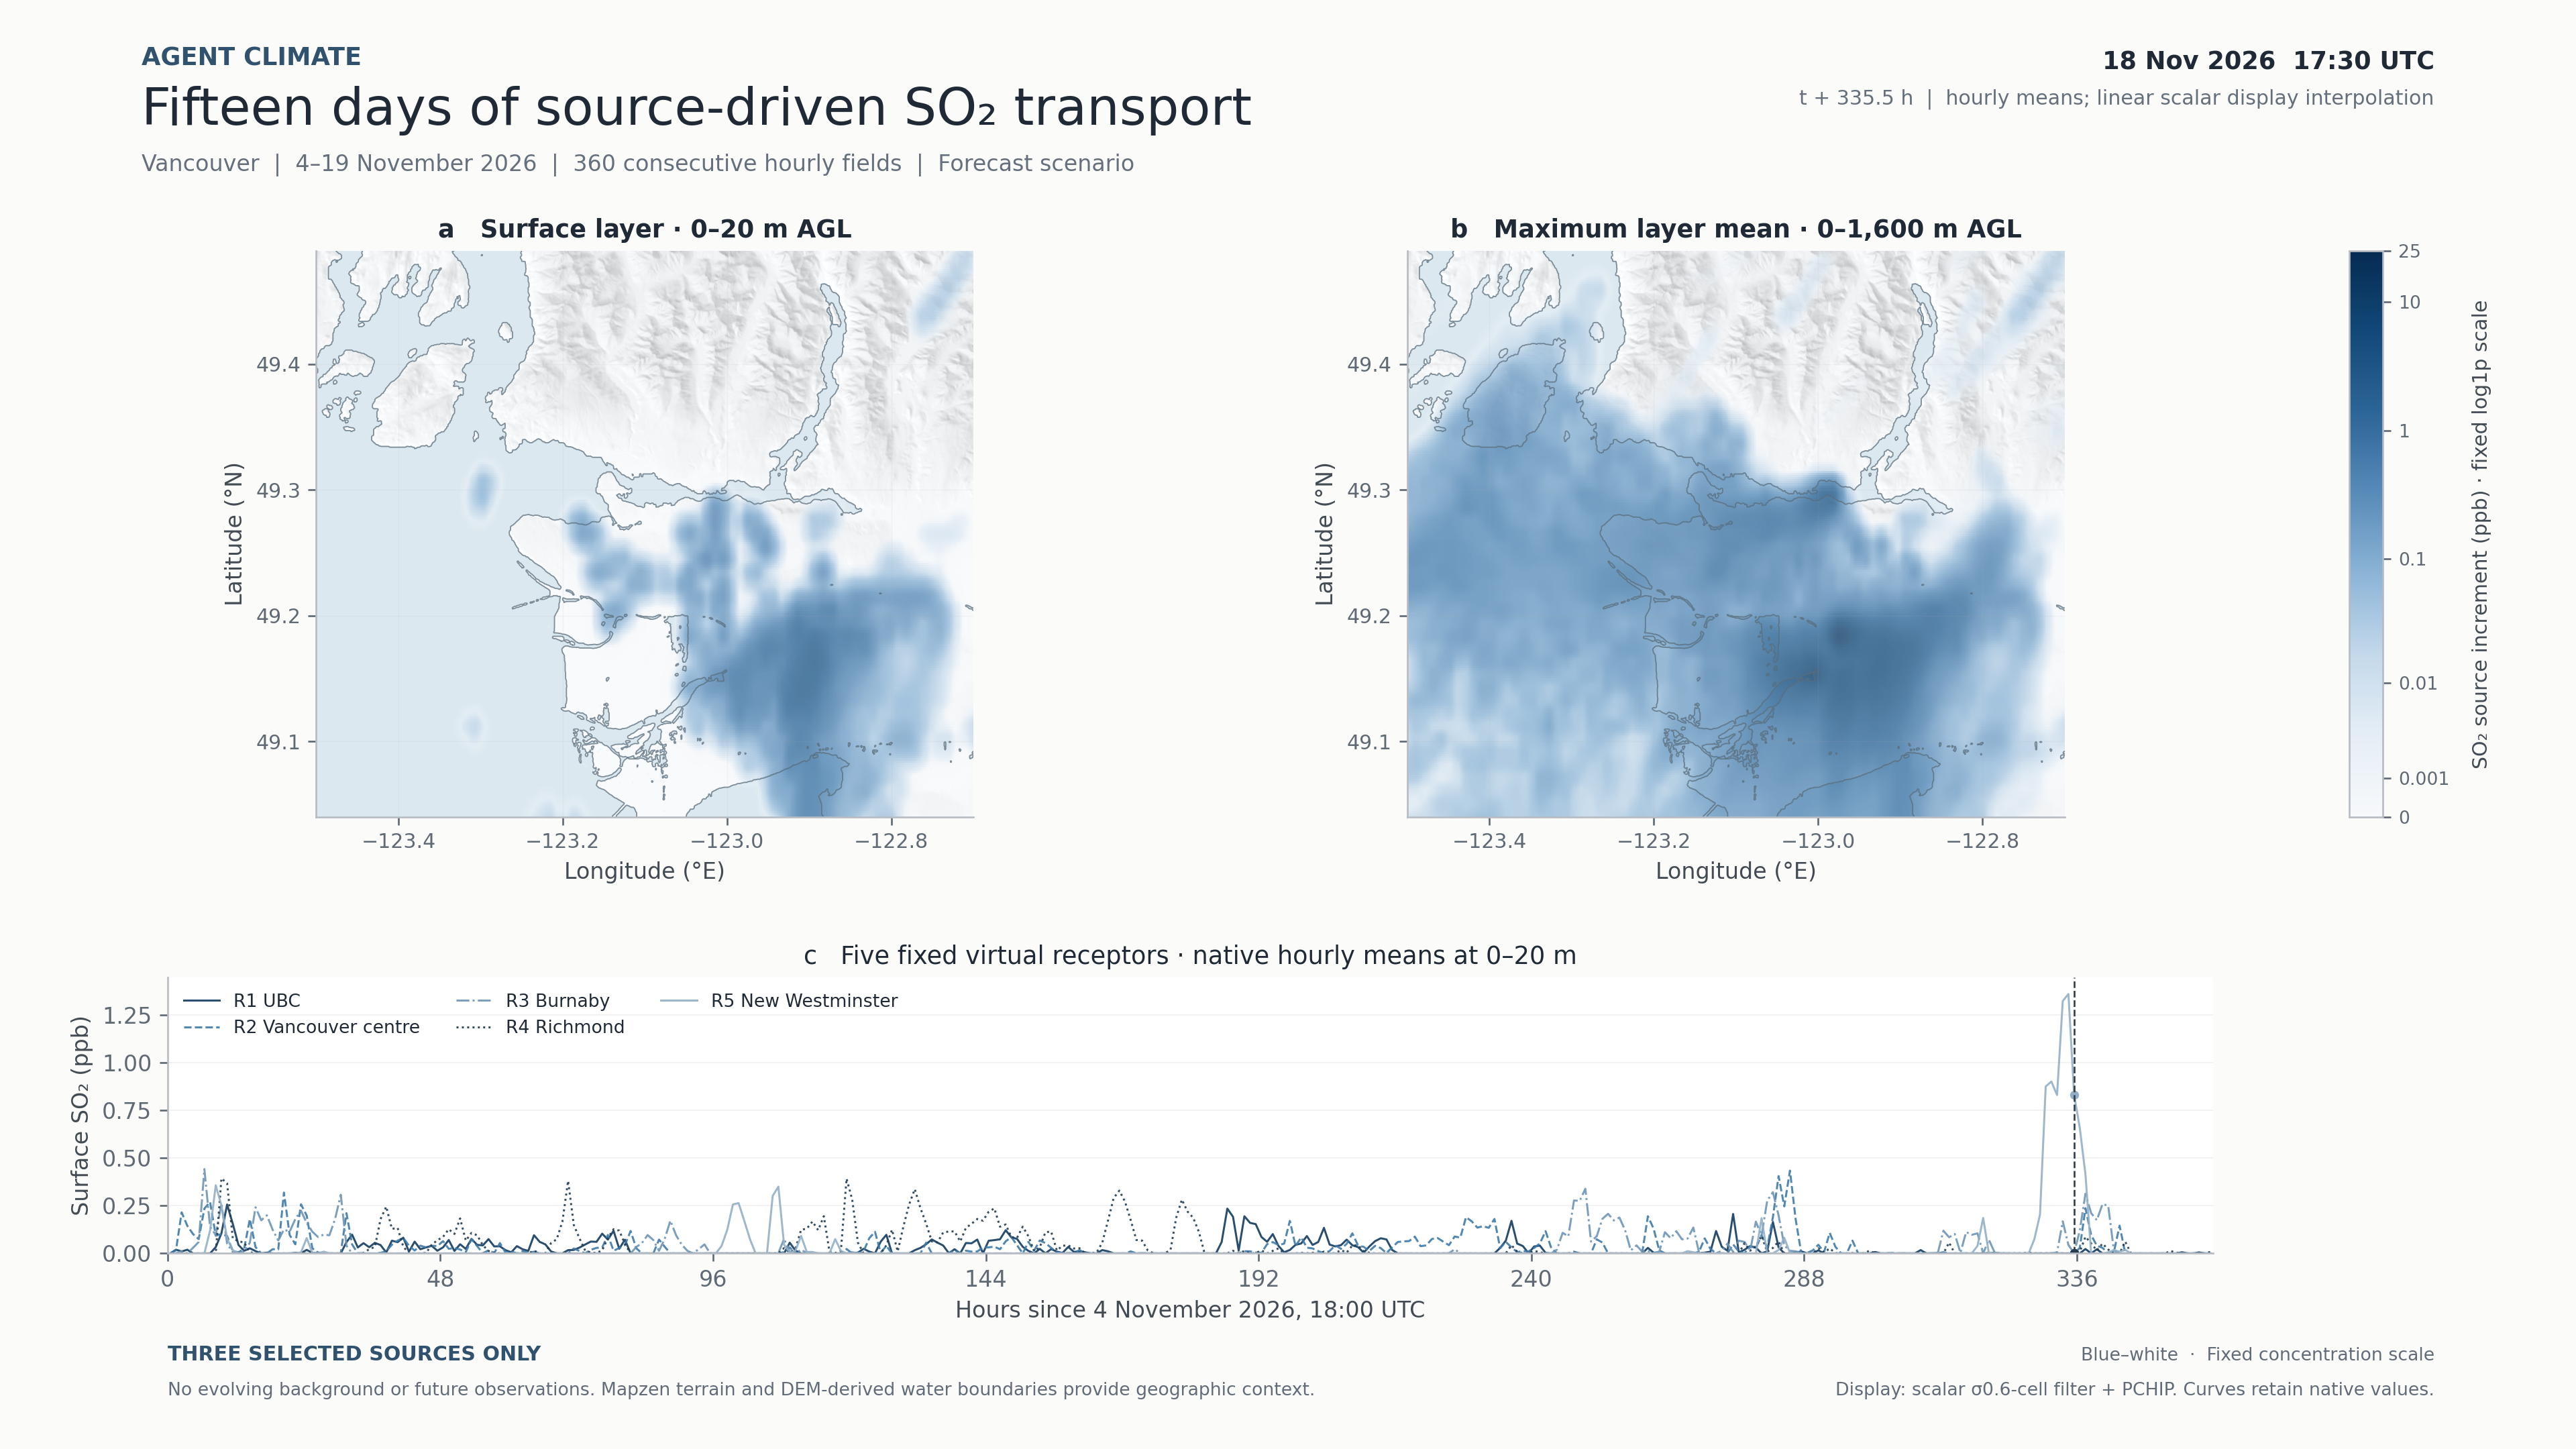
a

Surface layer

0–20 m above ground

ppb
b

Elevated plume

Maximum native layer mean within 0–1,600 m

ppb
SO₂ source increment / ppb
Fixed scale · log1p
Move over a map to inspect its native field.
4 Nov · 18 UTC360 continuous hours19 Nov · 18 UTC

White–blue represents increasing concentration. Terrain relief and water boundaries show Vancouver’s geographic shape without location labels. The right panel is a maximum across native layer means, not column-integrated mass. Maps use scalar display smoothing; curve values and native downloads retain the original data.

Loading the GPU display…

Five fixed virtual receptors

Native 0–20 m means · click the curve to move in time

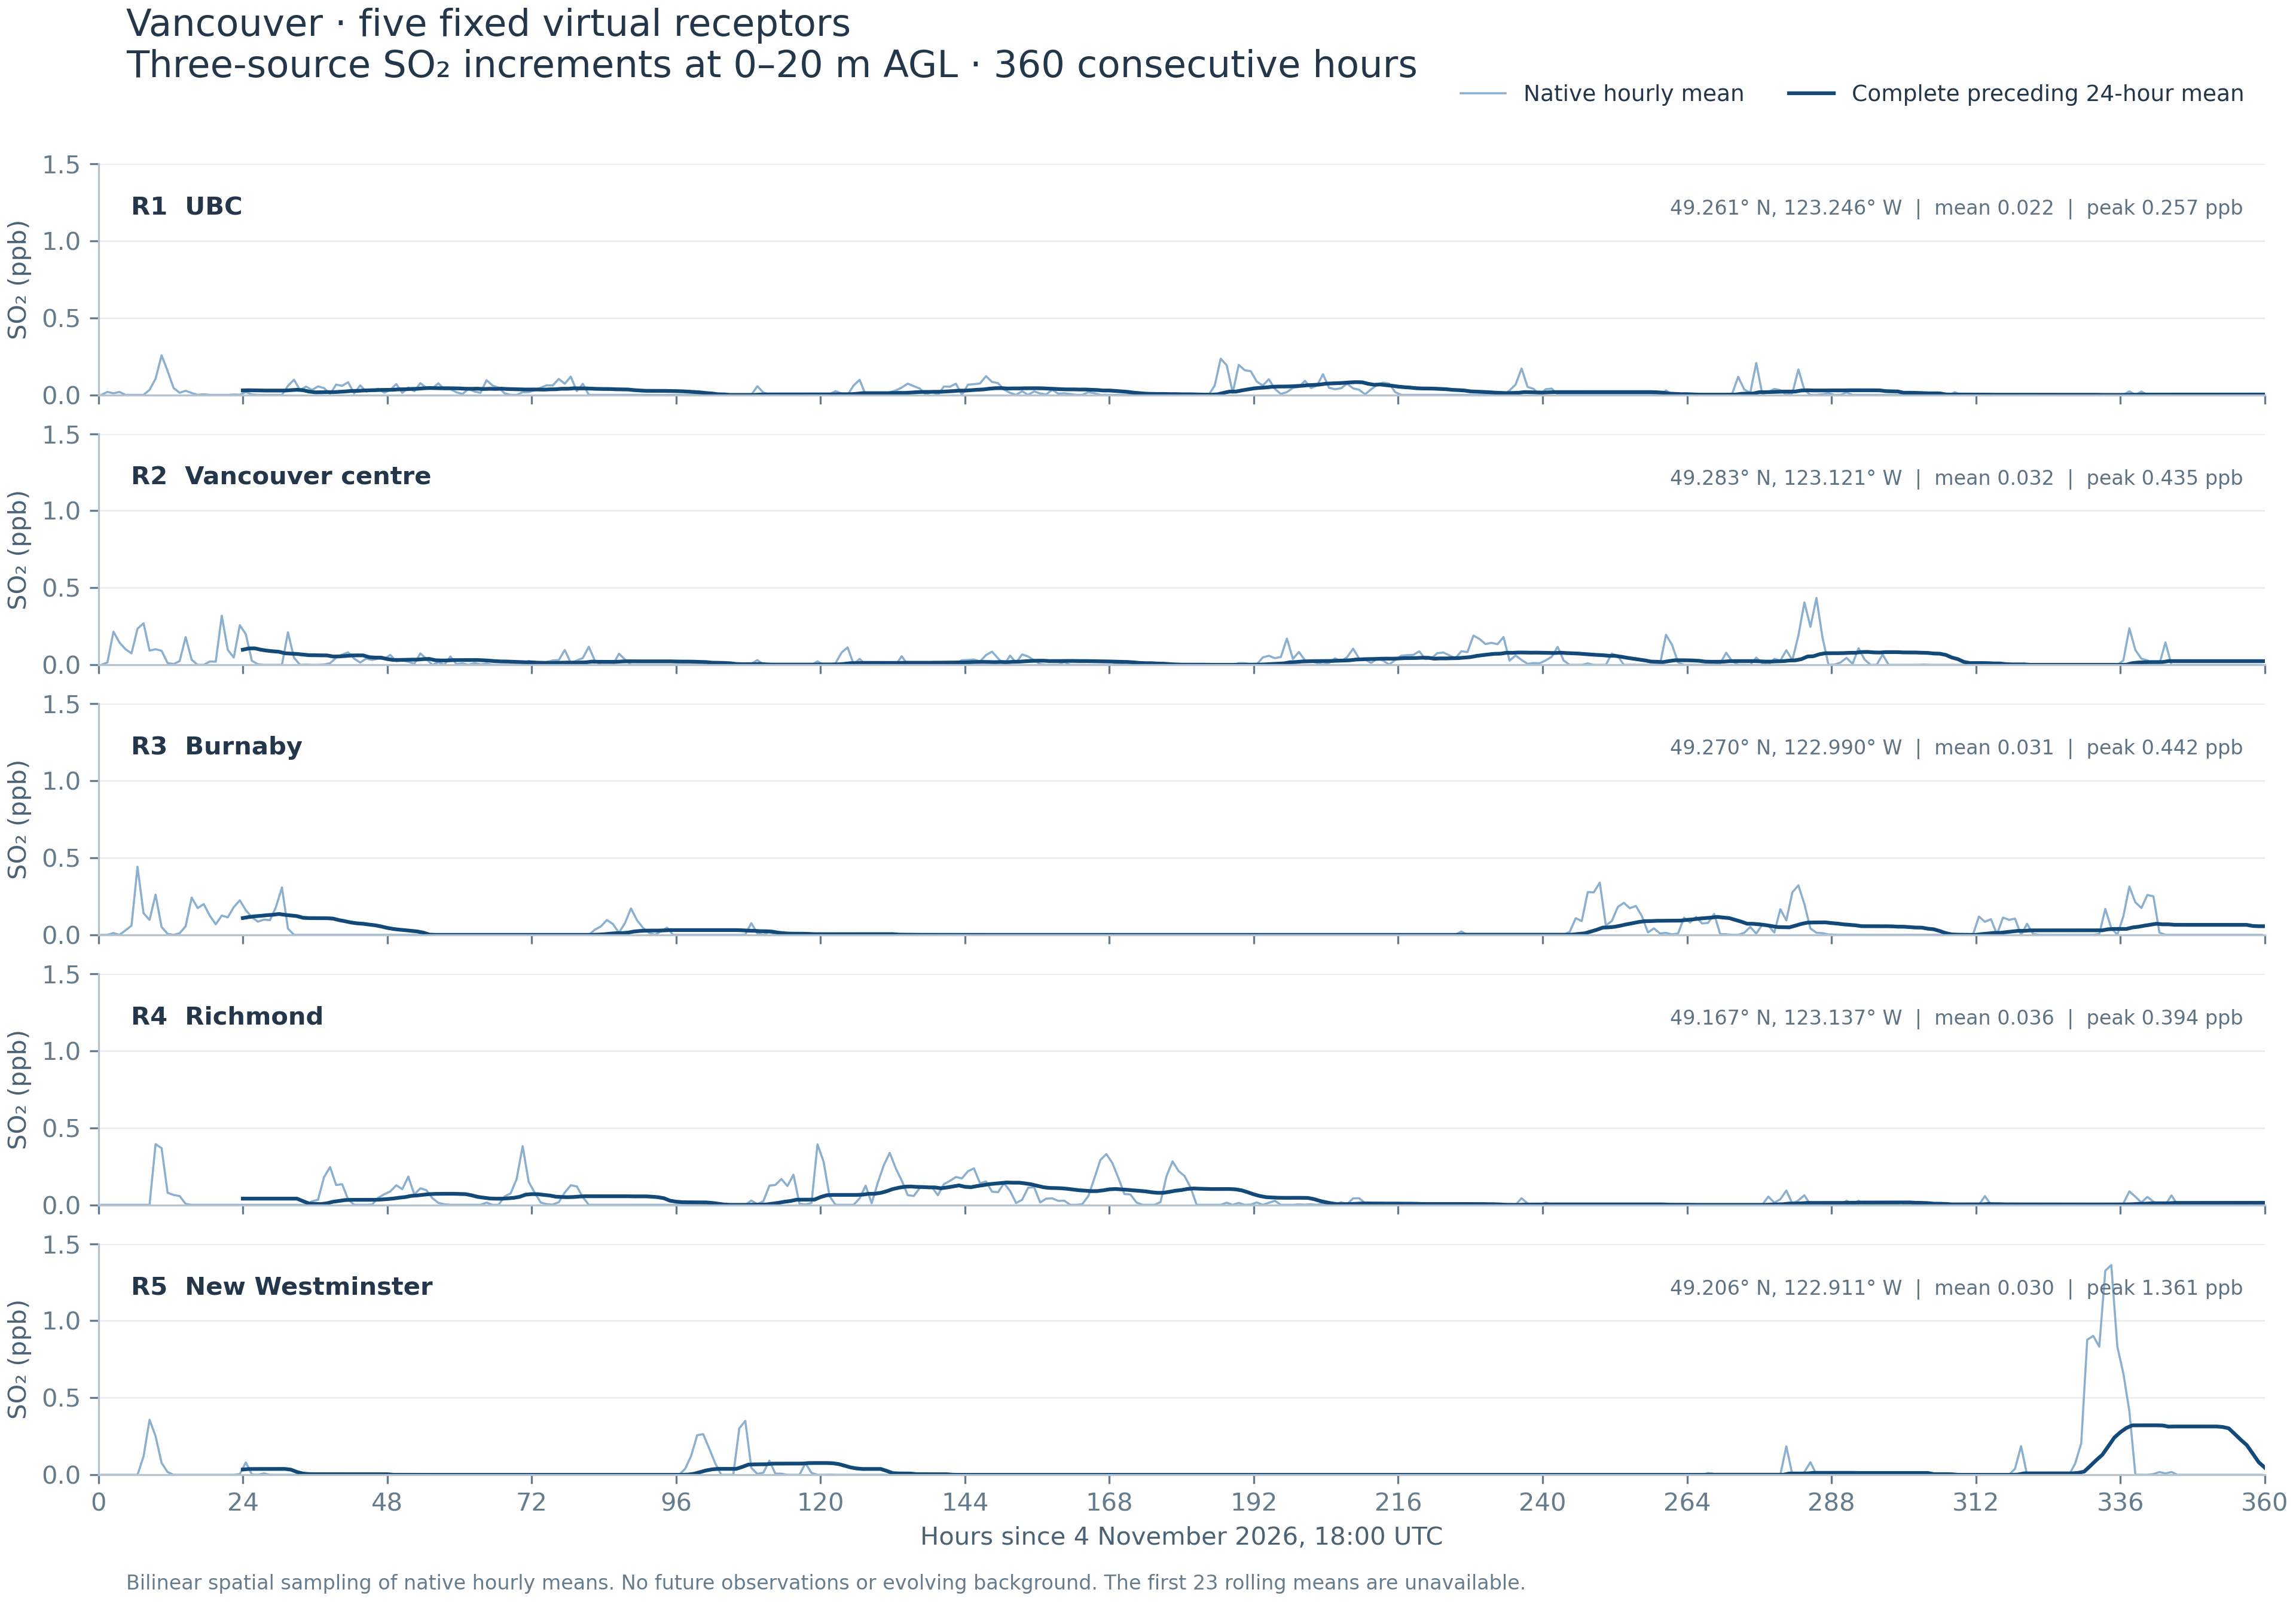
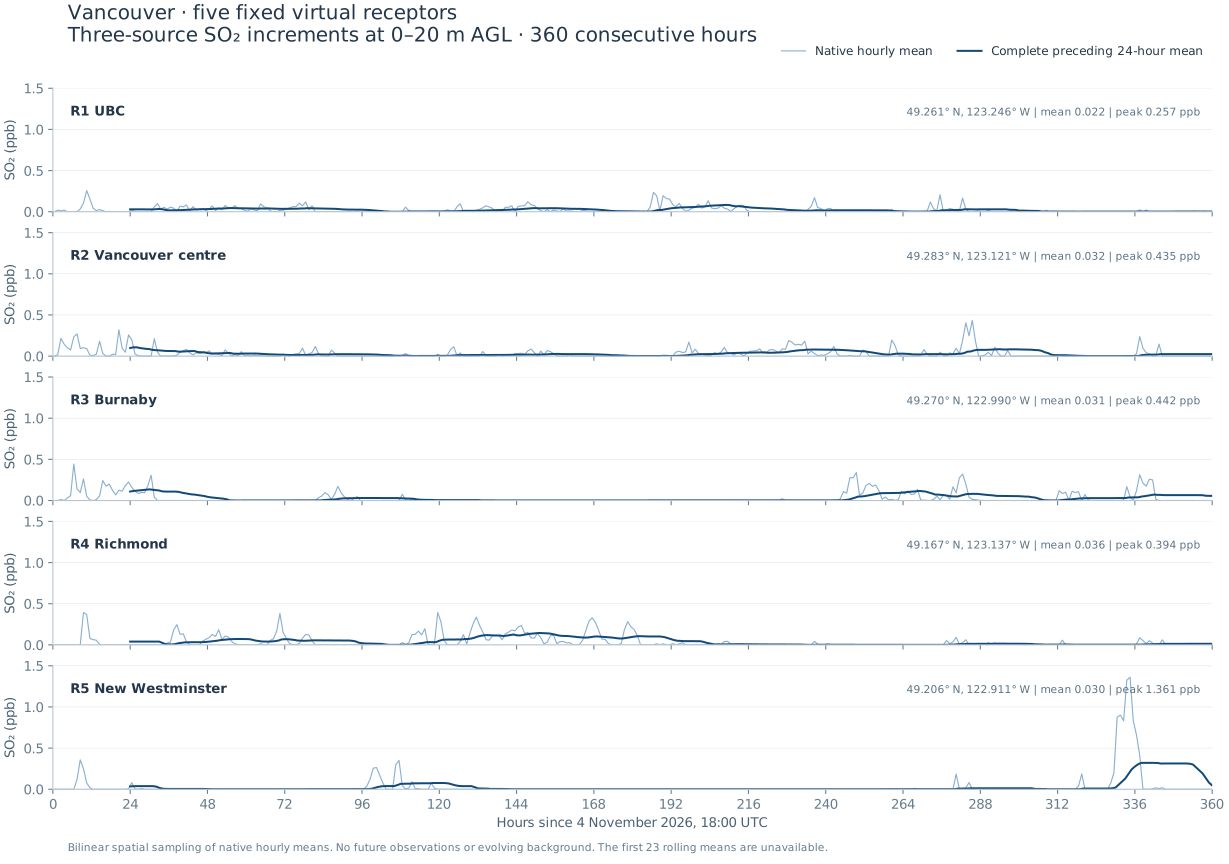
These are fixed geographic sampling positions, not monitoring stations. Hourly means are plotted at interval centres. Complete 24-hour means end at the stated hour; the first 23 are unavailable.

4K / INDEPENDENT FRAME RENDERING

The complete animation

All 360 hourly fields in a 30-second, 3840 × 2160 video, with the same fixed concentration scale and synchronized curves.

Download 4K MP4 ↓

02 / FINDINGS

What the simulation shows

Selected-source increments only
01

Receptor peaks are episodic.

At the five sampled positions, 360-hour means range from 0.022 to 0.036 ppb. The largest hourly receptor value is 1.361 ppb at New Westminster during hour 334–335. A period mean does not describe the largest short-duration event.

02

Surface zeros can coexist with an elevated plume.

In the defined urban-lowland rectangle, 69.5% of area × hours have an exact native surface zero. During 31.3% of area × hours, that surface zero coincides with a positive value in at least one of the higher native layers. Particle sampling and elevated transport both limit interpretation of surface zeros.

03

Removal accumulates over the full period.

Of 15.806 tonnes emitted by the three sources, 38.93% is dry-deposited and 19.99% wet-deposited by hour 360. Another 33.19% leaves the computational domain and 7.89% remains airborne. These are global source-ledger fractions.

The urban-lowland statistics use longitude −123.25…−122.90, latitude 49.10…49.33 and native terrain <80 m. The rectangle includes water and is not a municipal mask. Statistics use area × hour weights. No particle-count convergence study or future observation validation is available.

03 / FIXED RECEPTORS

Locations and numerical values

Open vector curves ↗
ReceptorLatitudeLongitude360 h mean / ppbHourly peak / ppbPeak interval / h

Bilinear sampling of native regular longitude/latitude cells. These values represent selected-source contributions to 0–20 m layer means, not breathing-height measurements or total ambient SO₂.

Publication figure: hourly and complete 24-hour meansFive panels of native hourly and rolling24 SO2 source contribution curves

3840 × 2700 PNG ↓ · Vector SVG ↓

04 / MASS BALANCE

Where the emitted mass went

Cumulative at hour 360

Source emissions: 15,805.930856 kg. Ledger residual: 0.000006681 kg. Outflow is explicitly counted at the computational boundary. Cumulative deposition snapshots are not summed over time. Source ledger CSV ↓

05 / DATA & METHODS

Figures, animation and source values

Interpretation and display method

Weather is the frozen 4 November 2026, 18 UTC GFS-driven, independent WRF-compatible JAX research trajectory; transport uses CPU-parallel FLEXPART. The three emission rates derive from 2024 reports and historical stack priors. This is a forecast scenario with no daily resets.

The display applies a Gaussian filter with σ = 0.6 native cell followed by shape-preserving PCHIP interpolation to scalar map diagnostics. Temporal interpolation acts on scalar values before colour mapping, and every video frame is rendered independently. Original fields, receptor curves and numerical summaries remain unfiltered. The interactive display uses logarithmic scalar compression (at most2.21% relative storage error above0.01 ppb), decoded before interpolation. The4K video is rendered from the uncompressed scalar display data. The finer display does not increase the approximately 0.7 × 1.1 km output-cell resolution or 3 km weather resolution.

The terrain uses cached Mapzen/Terrarium elevation tiles at approximately 50 m source spacing. Water boundaries are derived from the DEM and are approximate. Terrain detail is geographic context, not additional atmospheric resolution. Elevation attribution ↗

Initial background evolution was excluded after a local concentration fidelity failure. Source increments cannot establish total ambient concentration, exposure, or compliance. The 24-hour precipitation consistency check against a fixed CPU reference does not validate future 15-day weather.

Equations, qualification and existing evidence ↗